Showing posts with label data analysis. Show all posts

Saturday, 4 June 2022

Card sorting data analysis - Qualitative & quantitative ways


Card sorting data analysis

Card sorting is a method used to help design or evaluate the information architecture of a site. In a card sorting session, participants organize topics into categories that make sense to them and they may also help you label these groups. To conduct a card sort, you can use actual cards, pieces of paper, or one of several online card-sorting software tools. Card sorting helps us gain valuable insight about the structure of data. Know more 


There are some ways which UX researchers or designers can use to analyse the card sorting data and bring clear insights which helps in decision making. 


Card Sorting Data Analysis


Qualitative analysis

While conducting the card sorting activity in-person or remotely using moderated sessions, the notes & observation is considered as qualitative data. Qualitative analysis is helpful in understanding the schema of target participants and their thinking process. This gives high level idea about the trends & themes emerging from the sessions, which should be supported with quantitive data to bring clear insights. Hot picks in this kind of analysis is the new categories created by participants, top confusing cards, terminology issues, similar groups or card categories etc.


3 Months free Interaction Design Foundation


Quantitative analysis


1. Using spreadsheet (frequency & percentage)

Create a spreadsheet, listing the cards in the rows and the categories in the columns. From card sort’s results, determine how participants grouped the cards into the categories, then add the raw counts to the spreadsheet. Later replace the raw counts with percentages. Each percentage is the number of participants who sorted certain cards into a particular group divided by the total number of participants. Once you’ve calculated the percentages, keep only the percentages that are substantial enough to take into serious consideration. 

2. Using online tool

If you are using any online card sorting tools, they provide initial level analysis which are helpful in looking the data from a different perspective. Some of the most common type of analysis are as below:


DISCLOSURE: This post may contain affiliate links, meaning when you click the links and make a purchase, we receive a commission.

UX Design certificate by Google


Similarity Matrix: The similarity matrix is a simple representation of pair combinations, intended to give you a quick insight into the cards your participants paired together in the same group the most often.  Ref


Similarity matrix card sorting

OptimalSort’s Similarity Matrix 


Top UX Courses at Udemy


Dendograms: A dendrogram is a diagram that shows the hierarchical relationship between objects. It is most commonly created as an output from hierarchical clustering.  Ref


Dendograms card sorting

AAM Dendrogram in OptimalSort


Check top Card sorting tools 


References:

Card Sorting - Interaction Design foundation 


Dancing with the Cards: Quick-and-Dirty Analysis of Card-Sorting Data


The Pros and Cons of Card Sorting in UX Research

What is Information Architecture


7 best card sorting tool


3 Months free Interaction Design Foundation


Share:
Continue Reading →

Saturday, 5 February 2022

Top-3 Data-driven ways for exceptional user experience


Data driven UX design

Think data has no place in serious UX? 


After all, designers have always followed their 'instinct' and 'creative intuition' to birth impactful designs. While there's nothing wrong with this process, the advent of technology has led to an improved data-driven design discipline--one where data and design are one-and-the-same-thing.


Here's a quick run-through of why a data-driven design thinking process is critical for driving a more human-centered design--now more than ever:


  • It can help create an optimal user experience and improve business outcomes. In fact, research indicates that “Companies in the top third of their industry in the use of data-driven decision making was, on average, 5% more productive
    and 6% more profitable than their competitors.” 


  • It can provide a mix of empirical and intangible user data (aka quantitative and qualitative data) that covers the entire spectrum of the end-users journey with the brand--from the who and the what to the why and the how aspects.


  • It acts as a rich repository of user information that can help designers to stop relying on the standard industry best practices, find the correlation between the design and the user, and innovate at scale. 


The writing is on the wall: User experience design is no longer about choosing complimentary colors or creating a 'good-looking' design, it is about understanding the psyche of the end-user and using customer data to drive 'relatable,' 'useful,' and 'personalized' designs that engage and entertain. 


How to Use Data to Create a Human-centered Design? Top-3 Strategies


1. Conduct UX research, create an in-depth user persona, and gather critical user information:

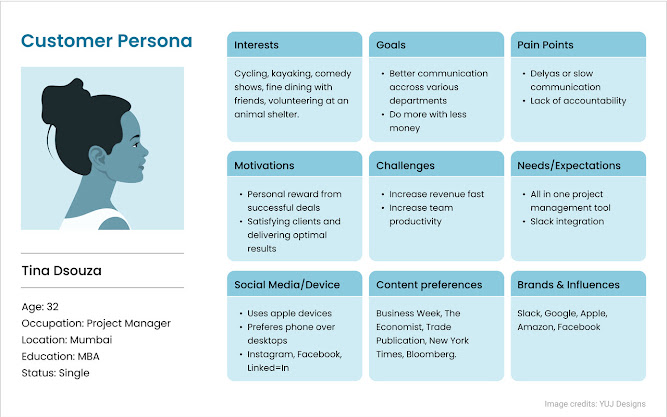
Think of user personas as the blueprint to your design-thinking process. Here's an example of a B2B buyer persona for inspiration that includes all the key elements such as basic demographics, goals, fears and challenges, hobbies and interests, and so on:


Buyer personas are reflective of your ideal customer and are always evolving with time. So make sure to collect data at regular intervals instead of collecting it all at one go. Before you start gathering the data for creating a buyer persona, ask yourself the following questions:


  • Why is building the user persona important in the overall design process?
Persona UX


  • What kind of tools, channels, and sources should you use to gather accurate information related to your user and build a comprehensive user persona?


Once you've gathered all the information, use the persona to guide your design thinking process in terms of who your ideal user is, what their motivations, requirements, attributes, and behaviors look like, and how design elements can positively influence their interaction with the brand. For instance, designers can integrate the most important product features within a particular design to reel the users in.


Interaction Design Foundation IDF  Free Membership Offer


2. Use data to integrate empathy and lay the foundation for a human-centric design approach:


"Data science is now an essential skill for every UX team. If you don’t have people who understand how to do data science, you cannot create great designs.”

— Jared Spool


Properly visualized data gives the design a human focus. It empowers designers to leverage empathy as a core design tool and make designing decisions that pave the way for useful and meaningful user experiences.


The best shot at delivering a human-centered design is by leveraging data to solve real-world problems and put the user's needs first, leading to an 'informed' design process. Without understanding your core audience's needs from emotional and rational perspectives, a human-centric design cannot be possible. 


Long story short, there's a greater need to blend the rational truth, which data provides, along with a designer's empathy-led thinking process. This simple-yet-significant strategy can empower brands to deliver an impactful user experience that actually solves the customer's key pain points instead of serving as mere 'eye candy.'


3. Uncover deep insights to redesign the UX:

In cases where the user experience needs to be redesigned (and not designed from scratch), data comes in handy. Brands can use the right mix of data analytics tools to understand:

  • What's going wrong within the user experience?
  • What's working well for the user experience?
  • Are the users engaging with the design?
  • What kind of recurring themes, patterns, and opportunities related to user behavior and experience seem to be jumping out from the data collated?


The end goal is to completely immerse yourself in the design research and extract deep insights into the positives and negatives. This collated data can then be used to segment users and target them specifically via different user experiences (if need be). 


Bringing it all together


Let's put the record straight: Data analytics can add value to the design thinking process by:

  • Rooting the design in real-time user data, which makes the design more personal and relatable for the end-user
  • Helping designers to understand the user from the inside out and use the information to visualize and create a powerful user experience
  • Enabling designers to amplify the design by marrying the business goals with the end-user's needs 


In the end, the primary challenge is not finding data in today's data-rich digital environment, it is making sense of the data gathered, followed by informing the design process to add value to the customer's life, one design at a time.


About author:


YUJ Designs


YUJ Designs

We are a global UX Design Studio delivering valuable experiences for humans that impact businesses. 


Website       LinkedIn


DISCLOSURE: This post may contain affiliate links, meaning when you click the links and make a purchase, we receive a commission.

UX Design certificate by Google

Share:
Continue Reading →

Monday, 3 May 2021

Survey research - Ways to clean survey data before analysis


Survey research data cleaning

A survey is a research method used for collecting data from a predefined group of respondents to gain information and insights into various topics of interest. The process involves asking people for information through a questionnaire, which can be either online or offline. According to Interaction Design Foundation “Surveys and Questionnaires – When you ask for many users’ opinions, you will gain massive amounts of information. Keep in mind that you’ll have data about what users say they do, as opposed to insights into what they do. You can get more reliable results if you incentivize your participants well and use the right format.”


Surveys are an important user research method, in which userinformation at bigger counts gets considered. Before stating with data analysis it is important to validate the data quality, else it may deteriorate the inferences and can lead to wrong insights. The data quality can be improved by doing detail data cleaning. 


DISCLOSURE: This post may contain affiliate links, meaning when you click the links and make a purchase, we receive a commission.

UX Design certificate by Google


Survey data cleaning involves identifying and removing responses from individuals who either don’t match your target audience criteria or didn’t answer your questions thoughtfully. There are several ways your survey data can have false data points which needs to be removed before beginning the analysis. Below are some of the ways you can clear false data from gathered survey data and improve the quality of your data. 


How to conduct data cleaning in survey


Remove partially completed responses - 

You might have noticed that sometimes few participants did not answer all the survey questions due to any reason (ex. Technical issue, fatigue, non-interest etc.) This partial filled data can create some noise in pure data analysis. It is advised to remove the partial completed responses from the overall data before starting analysis.   


Remove straightliners - 

Researchers needs to be cautious about straightline respondents and responses must be removed before analysis. Straightlining is when respondents choose similar answer option frequently (such as first/last option etc.). There might be higher possibility that the respondent has not responded the answers honestly. 

3 Months free Interaction Design Foundation


Remove Speed responses - 

Imagine the average time to complete your survey is 4:30 minutes and you have found the quickest response by one of the participant was 20 seconds. There is higher chances that quickest respondent might have completed survey just to complete. This kind of responses are called speed responses. There is no certain rule to identify such speed responses but some statistics calculation can help you such as: take average completion of time, check min and max range of time, set your own rule of remove responses which are x% less than the average. 

Remove outliers - 

Sometimes you have encountered responses falling under unrealistic range for example “In which sport you see yourself as pro” and one respondent selected all the sports from option. This kind of responses are called outliers. Outliers can not be said as fake response but also should be removed before starting analysis because it may impact some calculation ex. Range, min-max values, st. deviation, average etc. 

UX Design certificate by Google

Remove fake or manipulated answers - 

This becomes tricky sometimes but researchers should always be beware of fake or manipulated responses from participants. There are many ways to check fake responses such as, using open ended questions - check is any response contain unreadable or meaningless response like ‘fgfgfh’ type text etc. Another way is to check fake response by having multiple questions to validate response like one question “Do you play outdoor games? (With responses I don’t like playing outdoor game)”, after few questions another question can be added in survey like “which outdoor question do you like the most”. If some participants responding “I don’t like playing outdoor games” and later the same participants responding like they like football. These participants might have a high probability in faking the responses and can be eliminated from master data. 


Read more:

https://www.interaction-design.org/literature/article/useful-survey-questions-for-user-feedback-surveys?ep=uxness

https://www.uxness.in/2016/06/10-survey-tools-for-ux-designers.html 


3 Months free Interaction Design Foundation


Share:
Continue Reading →

Saturday, 19 January 2019

User Experience in Artificial Intelligence

Two years back, Toyota offered us a glimpse into their version of the future where surprisingly, driving is still fun. Concept-i is the star in the autonomous future where people are still driving. And in the case of Toyota, it's so much fun because they're cruising along with their buddy Yui, an AI personality that helps them navigate, communicate and even contributes in their discussions.


Yui is all over the car, controlling every function and even taking the wheel when required to. It's definitely an exciting future where the machine sounds and “feels” like a human, even exhibiting empathetic behaviour.

Related: Preparing for the Future of AI

That's the kind of future I'd imagine awaits user experience (UX) in the world of AI. A time when the human-AI connection is so deep that some experts say there will be “no interface.” But currently, UX does depend on an interface. It requires screens, for instance, and they don't do much justice to it. Integrating AI into the process will mean better experience all around.

From websites to homes and cars, here's how AI could help patch the holes and bring UX closer to maximum potential.


1. Complex data analysis.

Until now, to improve user engagement in their products, UX teams have turned to tools and metrics such as usability tests, A/B tests, heat maps and usage data. However, these methods are soon to be eclipsed by AI. It's not so much because AI can collect more data -- it's how much you can do with it.

Using AI, an ecommerce store can track user behaviour across various platforms to provide the owner with tips on how they can improve their purchasing experience, eventually leading to more sales. AI can be used to tailor the design to each user’s specifications, based on the analysis of the collected data.

All this is achieved through the application of deep learning that combines large data sets to make inferences. Additionally, these systems can learn from the data and adjust their behaviour accordingly, in real time. Thus, designers applying AI in their work are likely to create better UIs at a faster rate.


Free UX ebook


2. Deeper human connection.


By analysing the vast amount of data collected, AI systems can create a deeper connection with humans, enhancing their relationship. This is already happening in a couple of industries. When you think of Siri, you see a friendly-voiced (digital) personal assistant. When Amazon first introduced Alexa, it took the market by storm. But its usefulness could only be proven over time. And it was. Smart-home owners are using it to do a million things, including scouring the internet for recipes, schedule meetings and shop. It's also being used in ambulances. Even Netflix’s highly predictive algorithm is a case example of AI in use.

Toyota says Concept-i isn't just a car, but a partner. From the simulation video, you can see that Yui connects with the family on a level that current UX doesn't reach.

By using the function over and over, consumers end up establishing an interdependent relationship with the system. That's exactly how AI is designed to work. You use the system; it collects data; it uses it to learn; it becomes more useful; gives better user experience; you use it more as it collects data, learns and becomes more useful; and the cycle continues. You don't even see it coming -- and before you know it, you're deeply connected.


3. More control by the user. 

A common concern about the adoption of AI to everyday life is whether the machines might eventually rise and take over the world. In other words, users are concerned about losing control over the systems. It's a legitimate concern with the autonomous cars, robots guards and smart homes expected to become commonplace.

This lack of control is mirrored in the skepticism for the future, but it can also be seen in commerce and other areas where user experience is of great importance. For instance, a user will be more likely to enter their card information into a system if they feel they have control over when money is transferred, to whom it goes and that they can retrieve it in case something goes wrong.
As AI develops, users will gain more control over the system, gradually improving trust which will lead to more usage. 

In Which AI Could Enhance Your Company's UX 

UX design is about a designer trying to communicate a machine's model to the user. Meaning, the designer is trying to show the user how the machine works and the kind of benefits they can get from it, from the former's point of view. 

Traditionally, this involved following certain rules, and designers understood them very well. A designer knows how to create a web page by following certain rules that they can probably manipulate. With AI, however, the design is dependent on a complex analysis of data instead of following sets of rules. To be able to design using AI, designers will have to really understand the technology behind it. 

Mixing UX and AI as we can have played with “AIBO” 


Artificial intelligence
Artificial intelligence (AI), the ability of a digital computer or computer-controlled robot to perform tasks commonly associated with intelligent beings. The term is frequently applied to the project of developing systems endowed with the intellectual processes characteristic of humans, such as the ability to reason, discover meaning, generalize, or learn from past experience. Since the development of the digital computer in the 1940s, it has been demonstrated that computers can be programmed to carry out very complex tasks - as, for example, discovering proofs for mathematical theorems or playing chess - with great proficiency. Still, despite continuing advances in computer processing speed and memory capacity, there are as yet no programs that can match human flexibility over wider domains or in tasks requiring much everyday knowledge. On the other hand, some programs have attained the performance levels of human experts and professionals in performing certain specific tasks, so that artificial intelligence in this limited sense is found in applications as diverse as medical diagnosis, computer search engines, and voice or handwriting recognition.

What Is Intelligence?

All but the simplest human behaviour is ascribed to intelligence, while even the most complicated insect behaviour is never taken as an indication of intelligence. What is the difference? Consider the behaviour of the digger wasp, Sphex ichneumoneus. When the female wasp returns to her burrow with food, she first deposits it on the threshold, checks for intruders inside her burrow, and only then, if the coast is clear, carries her food inside. The real nature of the wasp’s instinctual behaviour is revealed if the food is moved a few inches away from the entrance to her burrow while she is inside: on emerging, she will repeat the whole procedure as often as the food is displaced.


Fixing the AI in real time

Problem solving, particularly in artificial intelligence, may be characterized as a systematic search through a range of possible actions in order to reach some predefined goal or solution. Problem-solving methods divide into special purpose and general purpose. A special-purpose method is tailor-made for a particular problem and often exploits very specific features of the situation in which the problem is embedded. In contrast, a general-purpose method is applicable to a wide variety of problems. One general-purpose technique used in AI is means-end analysis—a step-by-step, or incremental, reduction of the difference between the current state and the final goal. The program selects actions from a list of means—in the case of a simple robot this might consist of PICKUP, PUTDOWN, MOVEFORWARD, MOVEBACK, MOVELEFT, and MOVERIGHT—until the goal is reached.

Many diverse problems have been solved by artificial intelligence programs. Some examples are finding the winning move (or sequence of moves) in a board game, devising mathematical proofs, and manipulating “virtual objects” in a computer-generated world.
About Author
Jagannathan Kannan
UX Lead Designer @ Verizon wireless
LinkedIn


Share:
Continue Reading →